MSBIO, Inc.
0013Y0 · KOSDAQ · Healthcare · ₩216.8B (approx. $162.6M)
₩7,970-12.1%vs prev closeclose of 2026-10-30 · not real-time
Valuation summary
Not enough data
⚠ Low data — no grade yet Some inputs are missing, so the overall (composite) score can't be computed (newly listed or insufficient fundamental data). Use the individual metrics and chart signals shown below — it's unmeasured, not a low grade.
Score summary
Some axes lack data (–)
A summary of valuation factors — not a buy recommendation. You decide.
Data as of: 2026-10-30 · end-of-day, not real-timeData as of — price/valuation/technicals: the close date above · NPS stake: US=quarterly SEC 13F, Korea=annual · short interest: exchange's latest settlement · fundamentals: latest filing✦ Newly listed
Peers
| Company | PER | PBR | ROE | Div | Score |
|---|---|---|---|---|---|
| 엠에스바이오 | 21.1 | 3.1 | – | 0.0% | – |
| 뷰웍스 | 5.8 | 0.9 | 17% | 2.5% | 72 |
| 현대약품 | 56.4 | 1.4 | 1% | 0.5% | 27 |
| 휴온스 | 10.6 | 0.5 | 4% | 6.9% | 61 |
| 환인제약 | 9.4 | 0.5 | 5% | 2.9% | 67 |
| 삼진제약 | 11.1 | 0.8 | 9% | 4.1% | 55 |
Same sector, nearest by market cap · – = no data (value traps excluded)
Price chart
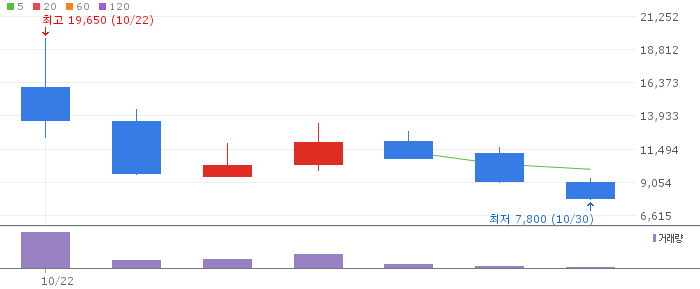
View on Naver Finance →· Chart: Naver Finance
The chart (long-term trend, Ichimoku cloud) is for observation only — not a buy or sell signal.
A highlight of the key metrics detailed below.
Why it looks cheap
- –
Why it might be risky
- P/E (Price/Earnings)21.1
- P/B (Price/Book)3.1
Strategy ranks
Top-tier in 0 of 1 evaluated strategies
Ranks within the Korea market — tap to open that ranking (ranks are per market).
Valuation
- P/E (Price/Earnings)
- 21.1
- Forward P/E
- –
- P/B (Price/Book)
- 3.1
- PEG
- –
- P/S (Price/Sales)
- –
- Dividend Yield
- 0.0%
- FCF Yield
- –
- EV/EBITDA
- –
- EV/Sales
- –
- Net Debt / EBITDA
- –
- P/CF (Price/Cash Flow)
- –
Quality & growth
- ROE (Return on Equity)
- –
- ROA (Return on Assets)
- –
- Rule of 40
- –
- Earnings Growth
- –
Past returns
1M
–
3M
–
6M
–
1Y
–
3Y
–
5Y
–
Past returns — they do not guarantee future results.
More indicators
Payout ratio
0.00%
Price/Graham
1.70
Pricey vs assets/earnings
Color: green = healthy, red = caution (absolute thresholds, value/quality metrics only). Downside vol & Sortino are annualized. Max drawdown = largest drop from a 3-year peak; volatility = 1-year annualized. Price/Graham < 1 = below Graham fair value (profitable, positive-equity names only). RSI < 30 = oversold. For reference only.
Long-term trend (Ichimoku)
A Japanese trend tool. Price above the 'cloud' is supportive; below is weak. A strong uptrend doesn't mean it's cheap — stocks that have run up are usually more expensive.
D
Inside the cloud (neutral)
W
Inside the cloud (neutral)
M
Inside the cloud (neutral)