Samyang Foods Co., Ltd.
003230 · KOSPI · Consumer Defensive · ₩8.6T (approx. $6.4B)· Nat'l Pension stake 8.49% (2024-12-31)
₩1,138,000-0.3%vs prev closeclose of 2026-10-30 · not real-time
Valuation summary
Looks fairly valued
Samyang Foods Co., Ltd., together with its subsidiaries, manufactures and sells food products in South Korea and internationally. It offers noodles, snacks, sauces, seasonings, dairy products, and frozen food under the Samyang 1963, Samyang Ramyun, Buldak, Map Tank, Pulse Lab,…· Source: company profile (yfinance/Yahoo Finance)
Valuation summary46/100Downside rigidity51/100Upside potential40/100
vs. fair value17 analysts
+64%Undervalued
Price ₩1,138,000Fair value ₩1,863,529
vs. analyst consensus target. The target is an opinion, not a prediction or buy signal.
Score summary
A summary of valuation factors — not a buy recommendation. You decide.
Data as of: 2026-10-30 · end-of-day, not real-timeData as of — price/valuation/technicals: the close date above · NPS stake: US=quarterly SEC 13F, Korea=annual · short interest: exchange's latest settlement · fundamentals: latest filing
Peers
| Company | PER | PBR | ROE | Div | Score |
|---|---|---|---|---|---|
| 삼양식품 | 17.4 | 5.6 | 38% | 0.6% | 46 |
| 아모레퍼시픽 | 30.9 | 1.6 | 5% | 1.0% | 40 |
| 에이피알 | 22.2 | 14.8 | 82% | 1.4% | 44 |
| 오리온 | 10.8 | 1.1 | 11% | 4.7% | 67 |
| 동서 | 19.6 | 1.6 | 9% | 4.1% | 38 |
| 코스맥스 | 15.0 | 4.3 | 32% | 1.3% | 41 |
Same sector, nearest by market cap · – = no data (value traps excluded)
Chart patterns matched (observational)
Technical patterns for reference — not a buy recommendation.
Price chart
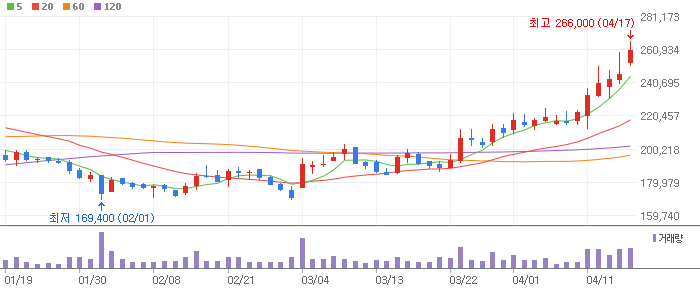
View on Naver Finance →· Chart: Naver Finance
The chart (long-term trend, Ichimoku cloud) is for observation only — not a buy or sell signal.
Structure analysis · observation only
Shows only where the current price sits within the channel structure (based on past swings).
Position: 0.0~0.5 zone · Downtrend channelStructure as of 2026-10-30
Channel levels (price by multiple)
- Baseline (0)₩1,283,776
- Current price₩1,138,000
- ×0.5₩1,071,958
- ×1₩860,141
- ×1.5₩648,324
- ×2₩436,506
- ×2.5₩224,689
- ×3₩12,871
Unfilled gaps
- Gap downabove priceBeyond chart₩1,601,046–₩1,606,024 · Gap width 0.31% · 2025-09-15
- Gap upbelow priceBeyond chart₩799,292–₩838,064 · Gap width 4.9% · 2025-04-10
- Gap upbelow priceBeyond chart₩714,313–₩729,195 · Gap width 2.1% · 2025-02-06
- Gap upbelow priceBeyond chart₩521,846–₩523,830 · Gap width 0.38% · 2024-12-02
The channel, levels and gaps are observational geometry showing where the current price sits within past swing structure. They are not a rebound/bottom probability, a price target, or a buy/sell signal — plain chart patterns carry no reliable predictive edge (our backtest conclusion).
A highlight of the key metrics detailed below.
Undervalued vs sector 12/100 within Consumer Defensive — higher means lower multiples (PER·PB·EV/EBITDA·PSR) than sector peers. Growth sectors carry higher multiples, so this is a same-sector relative view, not absolute cheapness (observational).
Why it looks cheap
- –
Why it might be risky
- Forward P/E15.2
Strategy ranks
Top-tier in 1 of 7 evaluated strategies
Ranks within the Korea market — tap to open that ranking (ranks are per market).
Valuation
- P/E (Price/Earnings)
- 17.4
- Forward P/E
- 15.2
- P/B (Price/Book)
- 5.6
- PEG
- 1.2
- P/S (Price/Sales)
- 3.1
- Dividend Yield
- 0.6%
- FCF Yield
- 1.7%
- EV/EBITDA
- 12.2
- EV/Sales
- 3.1
- Net Debt / EBITDA
- -0.12
- P/CF (Price/Cash Flow)
- 19.1
Quality & growth
- ROE (Return on Equity)
- 38.3%
- ROA (Return on Assets)
- 16.6%
- Rule of 40
- 62.2
- Earnings Growth
- 14.7%
Past returns
1M
-6.2%
3M
-6.5%
6M
-13.3%
1Y
-13.4%
3Y
+506.4%
5Y
+1330.7%
Past returns — they do not guarantee future results.
Enterprise value
Market cap
₩8.6T
Enterprise value (EV)
₩8.5T
Net cash
₩82.4B
vs market cap
99.2%
EV as reported by our data provider (Yahoo Finance) · net debt is our own calc (total debt − cash) · definitions differ, so EV need not equal market cap + net debt (minority interest, preferred stock)
More indicators
Sortino
-0.15
Downside vol
34.28%
Max drawdown (3y)
-37.17%
Moderate drop from peak
Volatility (annual.)
52.61%
Large price swings
RSI(14) daily
41.50
RSI(14) weekly
44.10
RSI(14) monthly
52.40
vs 200d MA
-6.31%
Below 200-day avg
Trend slope (annualized)
107.32%
Recent uptrend
FCF margin
5.23%
Beta
0.08
Moves less than market
Payout ratio
7.39%
Sustainable
Price/Graham
2.08
Pricey vs assets/earnings
Golden cross
○ aligned
Color: green = healthy, red = caution (absolute thresholds, value/quality metrics only). Downside vol & Sortino are annualized. Max drawdown = largest drop from a 3-year peak; volatility = 1-year annualized. Price/Graham < 1 = below Graham fair value (profitable, positive-equity names only). RSI < 30 = oversold. For reference only.
Long-term trend (Ichimoku)
A Japanese trend tool. Price above the 'cloud' is supportive; below is weak. A strong uptrend doesn't mean it's cheap — stocks that have run up are usually more expensive.
D
Below the cloud (weak)
W
Below the cloud (weak)
M
Above the cloud (supportive)
RSI divergence (timeframes)
Daily · cleared gate (tiny effect)
Of 24 backtested chart patterns, only the daily bullish variant cleared the 20-day excess-return gate (t=2.23). The excess was +0.68% — economically negligible — and the bearish variant did not clear it. Treat it as an observation, not a probability or buy signal.
–
Weekly · observational
Observational — no predictive edge confirmed in backtest (not a signal).
–
Monthly · observational
Observational — no predictive edge confirmed in backtest (not a signal). Over long holds it has tended to underperform the average.
📉 Bearish divergence (observed)
High pivots
2025-11-28 → 2026-08-31
When price falls while RSI makes a higher low, you are 'observing' selling pressure fading — not a forecast or a buy signal.