Sangsin Energy Display Precision Co.,Ltd.
091580 · KOSDAQ · Industrials · ₩347.9B (approx. $260.9M)
₩26,100+1.4%vs prev closeclose of 2026-10-30 · not real-time
Valuation summary
Looks fairly valued
Sangsin Energy Display Precision Co.,Ltd. engages in the manufacture and sale of secondary batteries in South Korea, China, Malaysia, Hungary, and internationally.· Source: company profile (yfinance/Yahoo Finance)
Valuation summary54/100Downside rigidity59/100Upside potential63/100
vs. fair value1 analysts
+15%Undervalued
Price ₩26,100Fair value ₩30,000
vs. analyst consensus target. The target is an opinion, not a prediction or buy signal.
Score summary
A summary of valuation factors — not a buy recommendation. You decide.
Data as of: 2026-10-30 · end-of-day, not real-timeData as of — price/valuation/technicals: the close date above · NPS stake: US=quarterly SEC 13F, Korea=annual · short interest: exchange's latest settlement · fundamentals: latest filing📉 Bearish divergence (observed)· 2026-08-31 → 2026-10-28
Peers
| Company | PER | PBR | ROE | Div | Score |
|---|---|---|---|---|---|
| 상신이디피 | 19.8 | 1.9 | 13% | 0.4% | 54 |
| 서희건설 | 1.8 | 0.3 | 22% | 5.0% | 59 |
| KPX홀딩스 | 1.3 | 0.3 | 23% | 6.8% | 67 |
| 현대퓨처넷 | 37.2 | 0.5 | 2% | 4.8% | 59 |
| 하이록코리아 | 6.3 | 0.8 | 13% | 4.4% | 82 |
| 삼양홀딩스 | – | 0.2 | -10% | 6.7% | 50 |
Same sector, nearest by market cap · – = no data (value traps excluded)
Chart patterns matched (observational)
Technical patterns for reference — not a buy recommendation.
Price chart
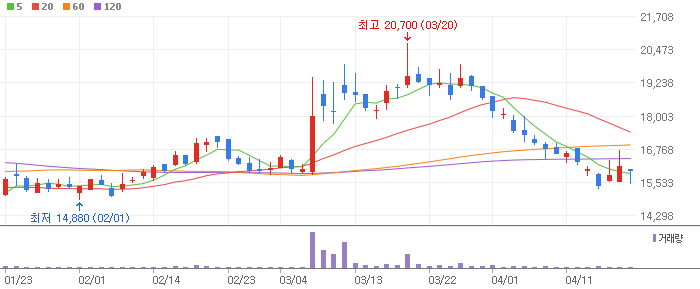
View on Naver Finance →· Chart: Naver Finance
The chart (long-term trend, Ichimoku cloud) is for observation only — not a buy or sell signal.
Structure analysis · observation only
Shows only where the current price sits within the channel structure (based on past swings).
Position: 0.0~0.5 zone · Uptrend channelStructure as of 2026-10-30
Channel levels (price by multiple)
- ×3₩69,239
- ×2.5₩60,620
- ×2₩52,001
- ×1.5₩43,382
- ×1₩34,763
- ×0.5₩26,144
- Current price₩26,100
- Baseline (0)₩17,525
The channel, levels and gaps are observational geometry showing where the current price sits within past swing structure. They are not a rebound/bottom probability, a price target, or a buy/sell signal — plain chart patterns carry no reliable predictive edge (our backtest conclusion).
A highlight of the key metrics detailed below.
Undervalued vs sector 29/100 within Industrials — higher means lower multiples (PER·PB·EV/EBITDA·PSR) than sector peers. Growth sectors carry higher multiples, so this is a same-sector relative view, not absolute cheapness (observational).
Why it looks cheap
- EV/EBITDA9.3
- EV/Sales1.4
- P/CF (Price/Cash Flow)7.5
Why it might be risky
- P/E (Price/Earnings)19.8
Strategy ranks
Top-tier in 1 of 6 evaluated strategies
Ranks within the Korea market — tap to open that ranking (ranks are per market).
Valuation
- P/E (Price/Earnings)
- 19.8
- Forward P/E
- 14.8
- P/B (Price/Book)
- 1.9
- PEG
- –
- P/S (Price/Sales)
- 1.2
- Dividend Yield
- 0.4%
- FCF Yield
- 2.6%
- EV/EBITDA
- 9.3
- EV/Sales
- 1.4
- Net Debt / EBITDA
- 1.55
- P/CF (Price/Cash Flow)
- 7.5
Quality & growth
- ROE (Return on Equity)
- 13.5%
- ROA (Return on Assets)
- 3.8%
- Rule of 40
- 51.2
- Earnings Growth
- –
Past returns
1M
+29.5%
3M
+119.5%
6M
-2.6%
1Y
+126.3%
3Y
+67.9%
5Y
+63.9%
Past returns — they do not guarantee future results.
Enterprise value
Market cap
₩347.9B
Enterprise value (EV)
₩417.5B
Net debt
₩69.6B
vs market cap
120.0%
EV as reported by our data provider (Yahoo Finance) · net debt is our own calc (total debt − cash) · definitions differ, so EV need not equal market cap + net debt (minority interest, preferred stock)
More indicators
Sortino
2.25
Downside vol
51.16%
Max drawdown (3y)
-66.43%
Deep historical drawdown
Volatility (annual.)
88.66%
Large price swings
RSI(14) daily
57.80
RSI(14) weekly
62.60
RSI(14) monthly
62.80
vs 200d MA
37.07%
Above 200-day avg
Trend slope (annualized)
9.01%
No clear trend
FCF margin
3.12%
Beta
1.52
Moves more than market
Payout ratio
6.13%
Sustainable
Price/Graham
1.30
Around fair value
Golden cross
○ aligned
Color: green = healthy, red = caution (absolute thresholds, value/quality metrics only). Downside vol & Sortino are annualized. Max drawdown = largest drop from a 3-year peak; volatility = 1-year annualized. Price/Graham < 1 = below Graham fair value (profitable, positive-equity names only). RSI < 30 = oversold. For reference only.
Long-term trend (Ichimoku)
A Japanese trend tool. Price above the 'cloud' is supportive; below is weak. A strong uptrend doesn't mean it's cheap — stocks that have run up are usually more expensive.
D
Above the cloud (supportive)
W
Above the cloud (supportive)
M
Above the cloud (supportive)
RSI divergence (timeframes)
Daily · cleared gate (tiny effect)
Of 24 backtested chart patterns, only the daily bullish variant cleared the 20-day excess-return gate (t=2.23). The excess was +0.68% — economically negligible — and the bearish variant did not clear it. Treat it as an observation, not a probability or buy signal.
📉 Bearish divergence (observed)
High pivots
2026-08-31 → 2026-10-28
Weekly · observational
Observational — no predictive edge confirmed in backtest (not a signal).
–
Monthly · observational
Observational — no predictive edge confirmed in backtest (not a signal). Over long holds it has tended to underperform the average.
–
When price falls while RSI makes a higher low, you are 'observing' selling pressure fading — not a forecast or a buy signal.